In order to test the latest venturi tube properly I have had to recalculate the areas of the different tube sections. I performed several calculations to find out the areas of the first and second sections of the tube.
 |
| 2D Cross Section of the Venturi Tube Design (Mark 4) |
The blue shaded area is a cylinder. The formula for calculating the cross sectional area of a cylinder is:
The area of the blue shaded section is therefore:
Which in metres is 0.0138590478.
The area of the red shaded section is a conical frustrum. The formula for calculating the area of a conical frustrum is (really complicated!) :
I used an online calculator:
Which in metres is 0.00189862567
The red and blue shaded areas combined make up A1:
The grey shaded section is a cylinder. Its cross sectional area (A2) is therefore:
We can now apply the formula for the venturi tube:
We will of course just insert these values into the previously written arduino code.
One of the requirements for this project is to display real time graphs on a small graphical display. The display I intend to develop with has not arrived yet. In preparation I thought it would be a good idea to look at using Python and matplotlib.
I have been playing with Python and installed Python 3.8.2 and got it added to my path (Windows 10). I then installed the matplotlib (library for plotting graphs) and watched a few youtube videos and read some tutorials.
I need to create these graphs:
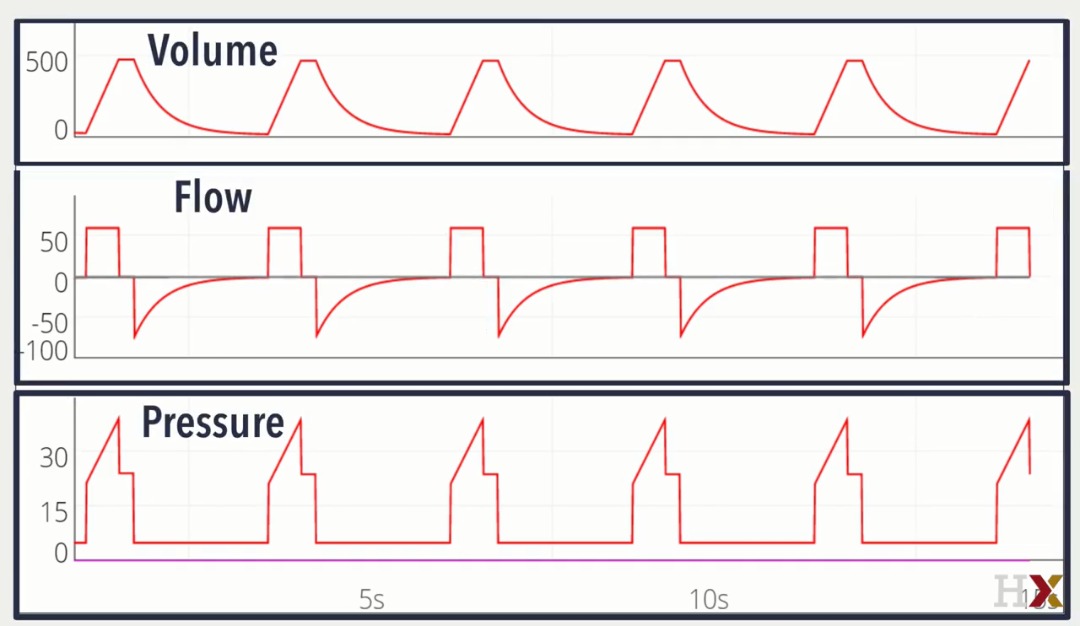
I have the data being delivered from the sensor so this should not be too difficult to achieve. Helpfully the graphs have scales and axes...
Many people have been requesting access to the 3D print design files:
Well that is enough for now - Take care...Langster!
No comments :
Post a Comment